top of page


Financial Accountability

In today’s economy, donors want to know that their hard-earned money is being used to the fullest potential to support their particular cause. Because Native American Heritage Association knows this is important to our donors and anyone wishing to choose a charity to donate to, we provide full disclosure of our financial accountability. So that you may make an informed decision about your charitable donation, please review the following information about Native American Heritage Association.

Charity Navigator Rating Breakdown


Financial Health
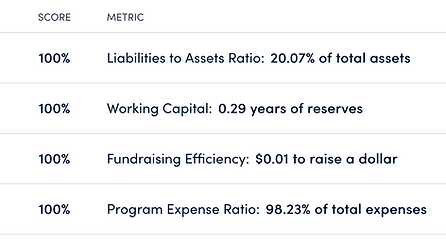
Accountability

Income Statement (FYE 08/2024)

Financial Charts


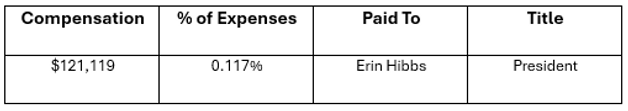
Compensation of Leaders (FYE 08/2024)
990 Forms & Schedules
2024:
2024 990 & 990T (PDF 8.36MB)
2024 Financial Statement (PDF 2.81MB)
2023:
2023 990 & 990T (PDF 10MB)
2023 Financial Statement (PDF 2.97MB)
2022:
2022 990 & 990T (PDF 10.9MB)
2022 Financial Statement (PDF 2.85MB)
2021:
2021 990 & 990T (PDF 32MB)
2021 Financial Statement (PDF <1MB)
2020:
2020 990 & 990T (PDF 3.08MB)
2020 Financial Statement (PDF <1MB)
2019:
2019 990T (PDF 1.62MB)
2019 990 (PDF 8.32MB)
2019 Financial Statement (PDF 1MB)
2018:
2018 990 & 990T (PDF 9.61MB)
2018 Financial Statement (PDF 1MB)
2017:
2017 990T (PDF 2.98MB)
2017 990 (PDF 22.8MB)
2017 Financial Statement (PDF <1MB)
2016:
2016 990 & 990T (PDF 3.26MB)
2016 Financial Statement (PDF 1.88MB)
2015:
2015 990T (PDF 3.3MB)
2015 990 (PDF 23MB)
2015 Financial Statement (PDF 7.46MB)
2014:
2014 990T (PDF 2.44MB)
2014 990 (PDF 3.05MB)
2014 Financial Statement (PDF 5.31MB)
bottom of page